

Embedded web server
Direct visualization from any browser. No client install required.

Features
atvise® offers a complete set of native features, with no plugins or per-module licenses. Everything is included from the first project, with the transparency and freedom you expect from a platform built on open standards. Some specific features, like redundancy or aggregates, require particular licensing conditions. You can review them in detail in the licensing section.
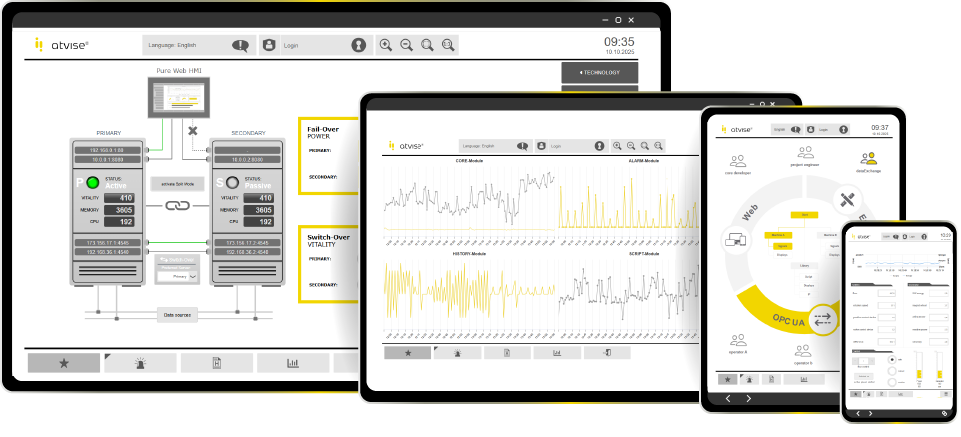
Direct visualization from any browser. No client install required.
Adaptive visualization for HMIs, tablets, mobiles or videowalls.
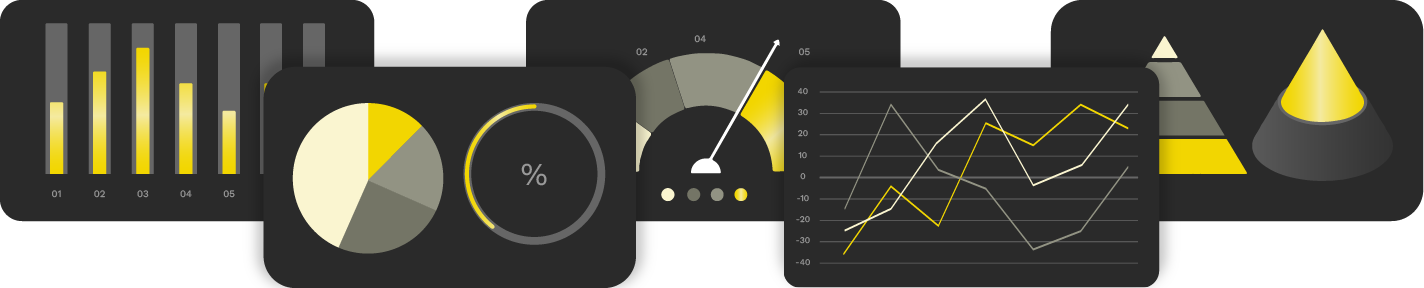
The most powerful web charting library, included in atvise® by default. Data analysis with top visual quality.
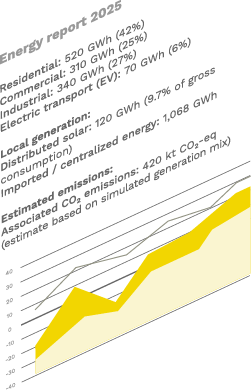
Scheduled or on-demand reports. Design your Excel templates and feed them with atvise® or external data.
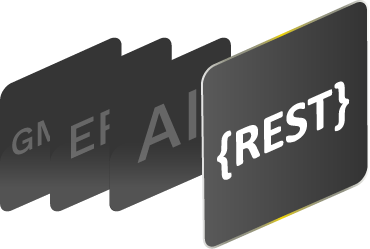
REST client and server to integrate with Artificial Intelligence, Business Intelligence, Business Analytics, ERP or CMMS tools.
The first SCADA system with hot standby redundancy in web technology. Instant server switchover with no data loss or service interruption.

Custom backend and frontend logic with a standard language.
Variable storage with no external servers. Access data via OPC UA Historical Access and REST API.

Statistical interval calculations historized. Stores only what matters. Includes 250 aggregates by default, expandable via a license add-on.

Reusable vertical structures per OPC UA model. Saves hundreds of hours of design, validation and maintenance.
Digital certificates, TLS/SSL 1.3 encryption for HTTPS and OPC UA. Meets the latest cybersecurity standards.

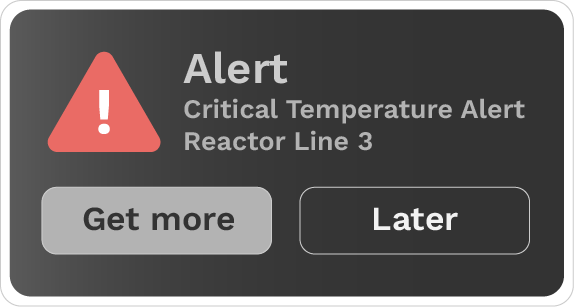
Alarm delivery by email, integration with external systems and real-time web visualization.
Access control based on users, groups and password policies. Integrable with Active Directory.

Interface adaptable to multiple languages from a single project. Ideal for global environments.

Granular logging of events and user actions, accessible via OPC UA HA and REST API.
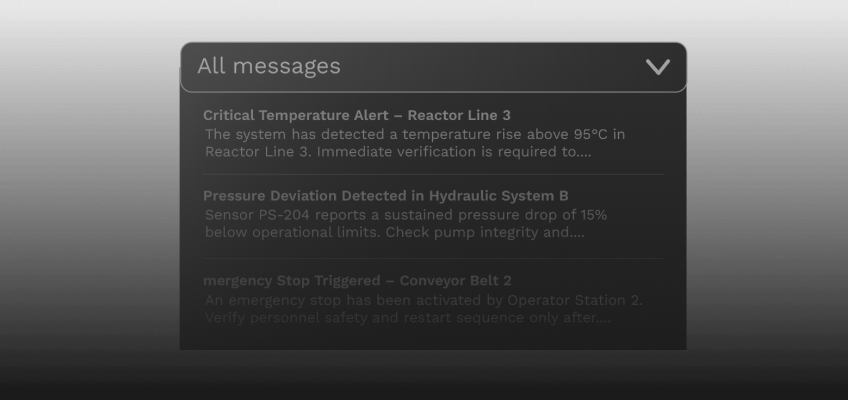
Alarm system with configuration by priority, groups, conditions and more. Alarms accessible via OPC UA A&C and REST API.
Extensions by Vester Business
Extend atvise®'s capabilities with libraries developed by our team for environments that demand richer visualization, deeper analysis or advanced data integration. These libraries are ready to use, integrate directly into your project and multiply the system's possibilities without relying on external solutions.
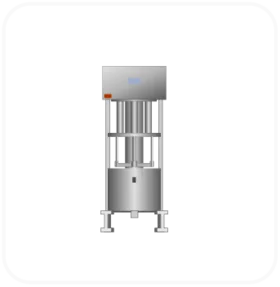
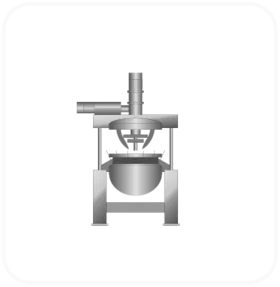
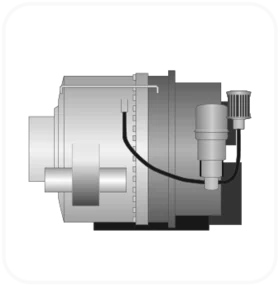
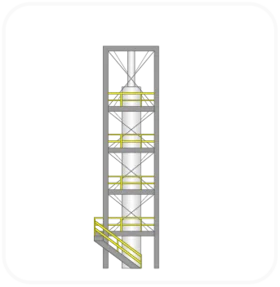
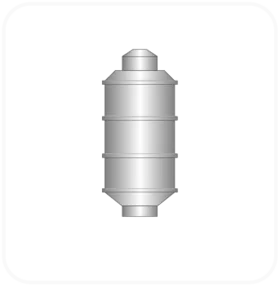
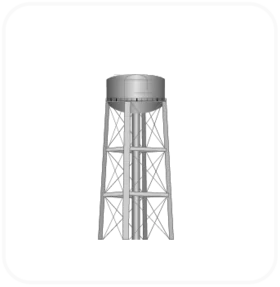
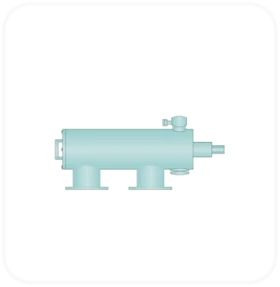
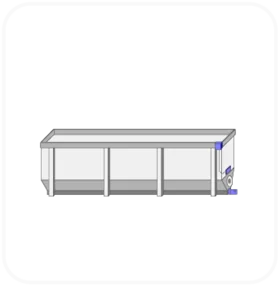
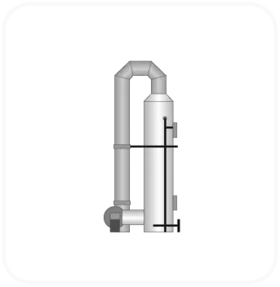
Over 70 ready-to-use graphic objects, designed to the ISA-101 standard and organized by industrial sector. Each object includes visual indicators for states, alarms, alerts and maintenance. Integrate them directly or build your own objects from their base structure. The separation between visualization and logic lets you customize the visual look without altering functionality.
Includes:
This library raises the visual level of your SCADA projects, standardizes presentation by industry and saves you hours of design thanks to its modular, flexible and reusable approach.











Design advanced industrial dashboards directly in atvise®, with no external tools or code. This library lets you build professional KPI panels in minutes, combining flexibility, precision and a high-end visual experience.
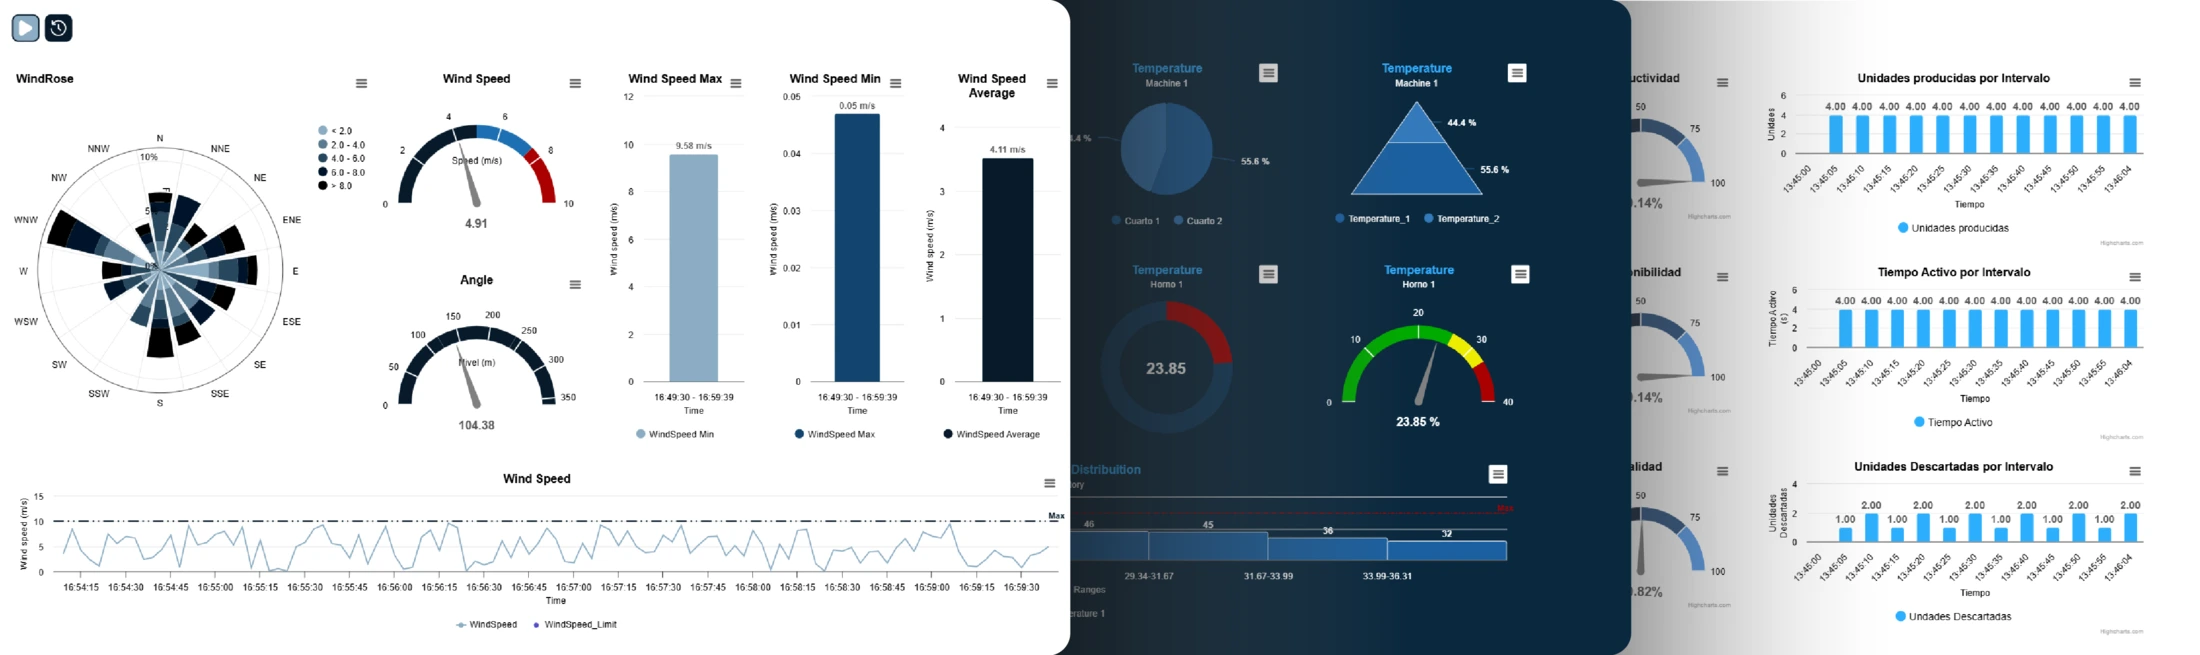
Data processing included (no scripting):
Max, min, averages per interval
Integration (area under curve), change counting, ON/OFF time
Calculations per interval or over full ranges
OEE, energy efficiency and custom formulas
Grouping by dynamic or custom categories
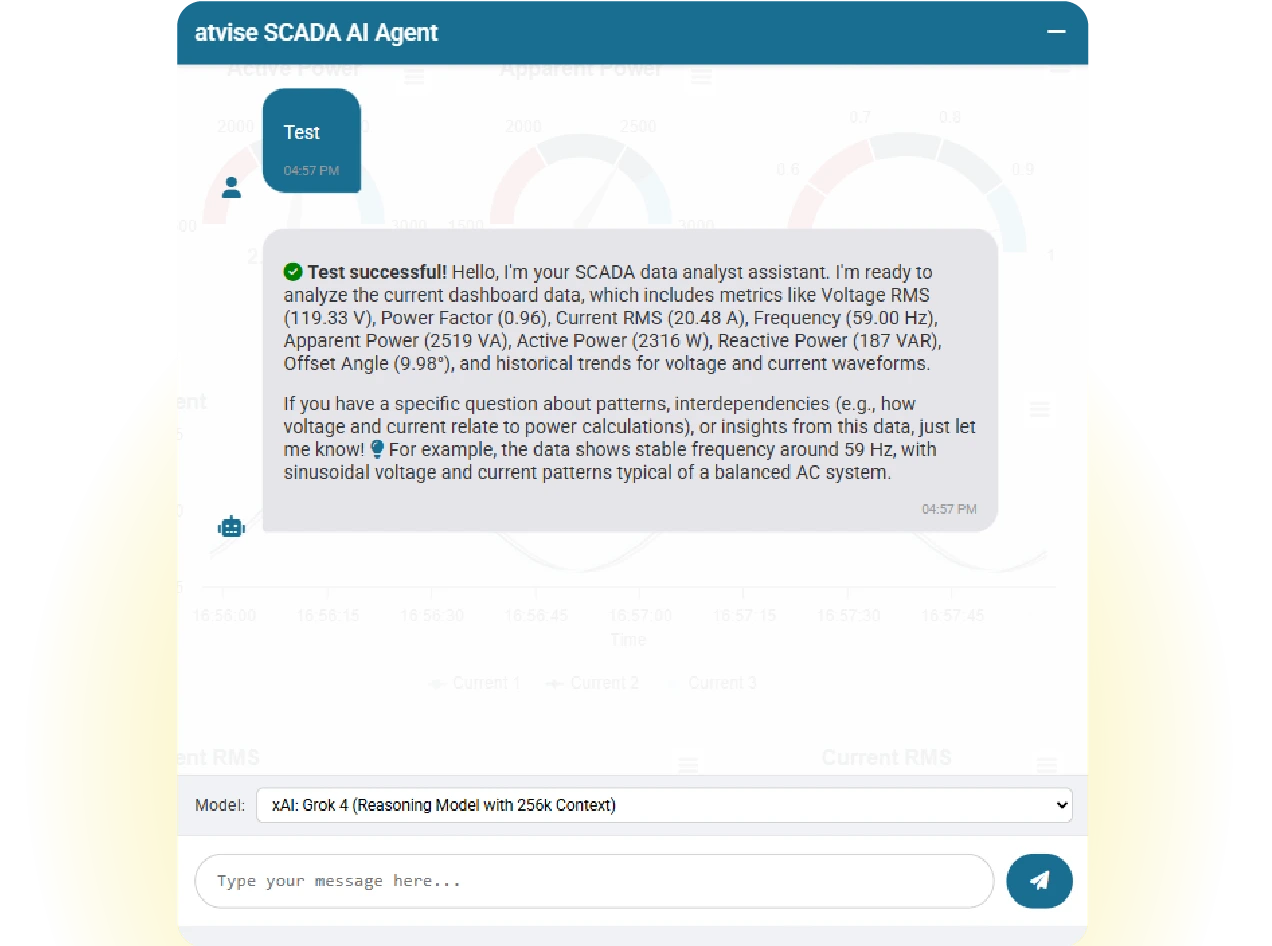
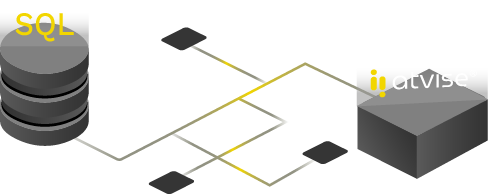
Connect atvise® to any SQL database (MySQL, SQL Server, PostgreSQL, MariaDB) via ODBC. Configure and monitor your connections from a secure web interface and start creating transactions with no coding.
It turns atvise® into a direct bridge between your industrial data and any SQL database, with visual, secure and customizable management that simplifies integration to the maximum.
Experience the power of atvise® SCADA with all integrated functions and advanced extensions.